Executive Summary:
- Speed problems can be challenging for many students. They often feel confusing. In PSLE maths, students understand speed, distance and time. When too much information is presented at once, this can get challenging. Visual tools like graphs and models help simplify these questions. They make problem-solving more organised. It becomes clearer. Step by step.
- Distance-time graphs allow students to see movement visually. Bar models help compare values more effectively. These methods reduce confusion and they improve accuracy during calculations. Instead of relying on memorisation, students understand the logic behind the question. That makes a difference. A big one.
- Many students strengthen these skills through structured guidance. PSLE Maths tuition often focuses on visual strategies and repeated practice. The best PSLE maths tuition programmes teach students how to break questions.
Speed problems can feel confusing at first. Many students struggle with them. Numbers move quickly in these questions and information is often packed into a few lines. Students are expected to calculate speed, distance or time. Mistakes are commonly made when the relationships are not understood clearly. This is why visual methods are useful and they help simplify the problem step by step. It becomes easier. When you can see it.
In many PSLE maths questions, graphs and models are used to explain movement. These tools improve understanding and they help students organise information more effectively.
Why Speed Problems Feel Difficult
Speed questions involve multiple concepts together. Students must understand formulas and interpret situations at the same time. Important details are sometimes missed and calculations become confusing.
When information stays only in words, the problem may feel harder than it actually is. Visual support helps a lot. This is why many teachers include diagrams and models in every good PSLE Math Guide.
Understanding the Basic Speed Formula
Before using graphs or models, students should know the basic formula. It is essential. The relationship between speed, distance and time should be understood clearly. It forms the foundation of these questions.
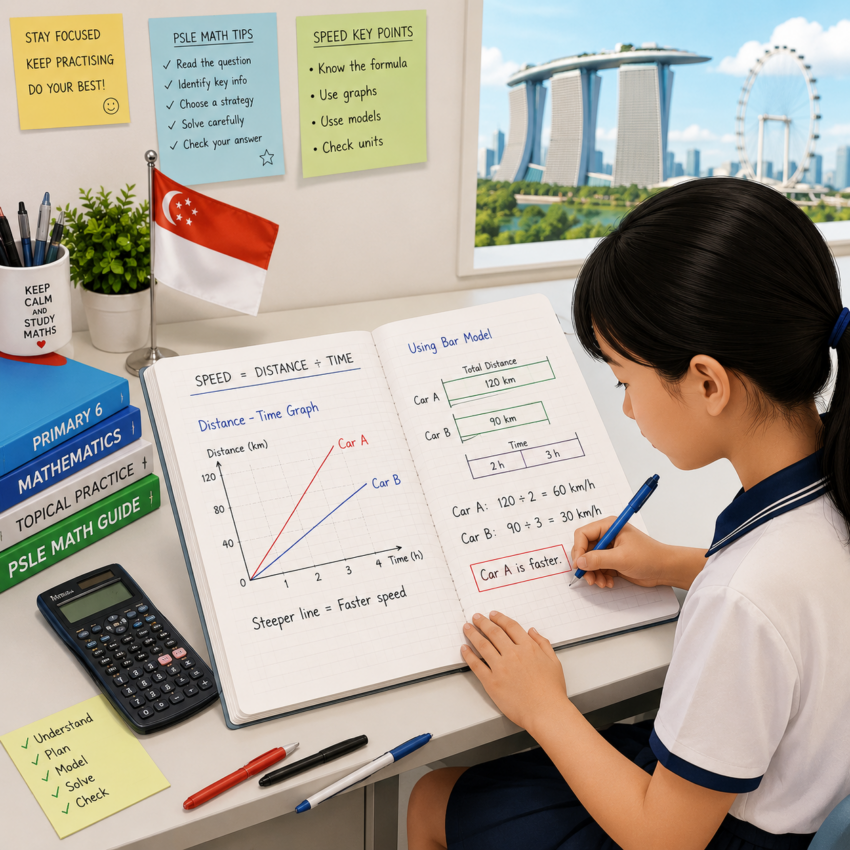
Speed = Distance ÷ Time
This formula is simple and it is used repeatedly in different ways. Sometimes speed is missing and students must calculate it. In other cases, distance or time is unknown and the formula must be rearranged correctly. Practice is important.
How Graphs Help in Speed Problems
Graphs turn information into visuals. That changes everything. Instead of reading long descriptions, students observe movement on a graph. Distance-time graphs are commonly used. They show how far an object travels over a period of time. You can spot patterns quickly. Without guessing.
For example, a steep line on a graph represents faster movement. A flat line usually shows that no movement is happening. These details are understood visually and interpretation becomes easier.
Using Models to Break Down Problems
Models simplify complicated questions. They organise information. Bar models are often used in PSLE maths. They help students compare distances and timing visually. Instead of solving everything mentally, values are placed into sections. Then the relationships become clearer. It reduces confusion. Significantly. The comparison is displayed visually and calculations become more manageable.
Example of a Speed Problem Using a Model
Let’s look at a simple example. It helps understanding.
Sarah travelled 120 km in 2 hours, while Ben travelled 150 km in 3 hours.
Sarah: 120 km ÷ 2 = 60 km/h
Ben: 150 km ÷ 3 = 50 km/h
Sarah travelled faster. The model makes it obvious.
Common Mistakes Students Make
Students often rush calculations. That leads to errors. Units may be mixed up and the formula is sometimes used incorrectly. Graphs are not interpreted carefully and important information gets missed. These mistakes are common but they can be corrected with regular practice. Slow down. Check your steps.
Another mistake is relying only on memorisation. Understanding the relationship between speed, time and distance is much more important.
Tips to Solve Speed Problems Better
You should always identify what the question is asking first. Don’t calculate immediately. Highlight important information and decide whether a graph or model can help. Draw simple visuals if needed and organise the data clearly before solving. This reduces confusion and accuracy improves. Visual thinking works. Especially in maths.
Many students also benefit from structured learning methods offered through PSLE Maths tuition. Where speed problems are broken into manageable steps.
Why Practice with Visuals Improves Confidence
Confidence grows when students understand the process. Not just the answer. Graphs and models train students to think logically. They improve problem-solving skills over time. It becomes less stressful. This is why the best PSLE maths tuition focus heavily on visual strategies.
The Role of PSLE Maths Tuition
Some students need more structured guidance. In PSLE Maths tuition, concepts are explained step by step. And visual methods are taught clearly. Students practise using graphs and models regularly and mistakes are corrected early. This strengthens understanding and confidence improves steadily. Support matters. Especially with challenging topics.
FAQs
Why are speed problems difficult for students?
They involve multiple concepts at once. Without proper understanding, mistakes are easily made. Visual methods help.
How do graphs help in solving speed problems?
Graphs make information easier to understand. They simplify movement. Distance-time graphs show how far an object travels over time. Students can identify patterns more clearly. Faster movement is represented by steeper lines and comparisons become easier. It improves clarity.
What models are used in PSLE maths speed questions?
Bar models are commonly used. They organise information well. These models help students compare values visually. Relationships between speed, distance and time become easier to understand. They reduce confusion.
What are common mistakes in speed problems?
Students often rush through calculations. That causes errors. Units may be mixed up and formulas are sometimes used incorrectly. Important information on graphs can also be missed. Always check your work.
How can students improve at speed problems?
Practice regularly and use visual methods. It helps a lot. Students should draw graphs or models whenever possible. They should focus on understanding the question before solving it. A strong PSLE Math Guide also supports better learning. Stay consistent.
